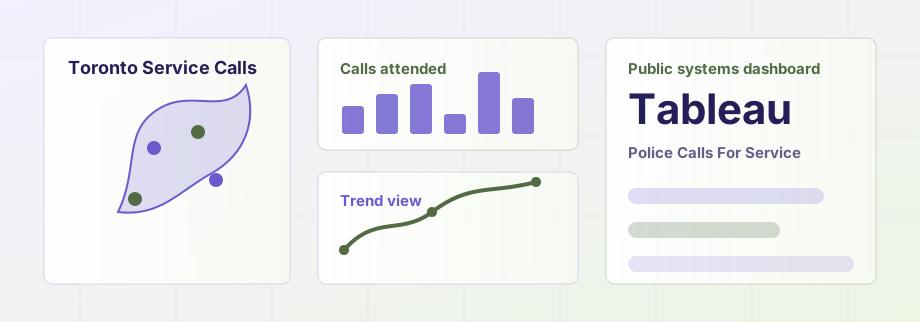
This project presents police calls for service attended in the City of Toronto through an interactive Tableau dashboard. It connects data visualization with public systems analysis by making patterns easier to scan, compare, and discuss.
Service Demand
Explore how attended calls can be viewed as public service activity across time and place.
Visual Analysis
Use dashboard views to compare patterns, spot concentration, and support clearer interpretation.
Public Systems Lens
Frame the data as part of city operations, community safety, and civic resource planning.